How do the Caucasus countries live?
The 2008-2009 economic crisis was followed by a recovery period (2010-2013), during which the economies of the Caucasus region countries were growing on average by 5% annually.
The situation aggravated again starting from 2014 and that was initially conditioned by Russia’s military invasion in Ukraine (due to which Russia was imposed economic sanctions). A sharp drop in oil prices further exacerbated the situation, since Russian and Azerbaijani economies largely depend exactly on the oil prices.
An average economic growth rate in the region countries reduced to 1,7%.
There national currencies of all Caucasus region countries experienced considerable depreciation. The inflation rate increased, whereas dollar-denominated per capita income decreased.

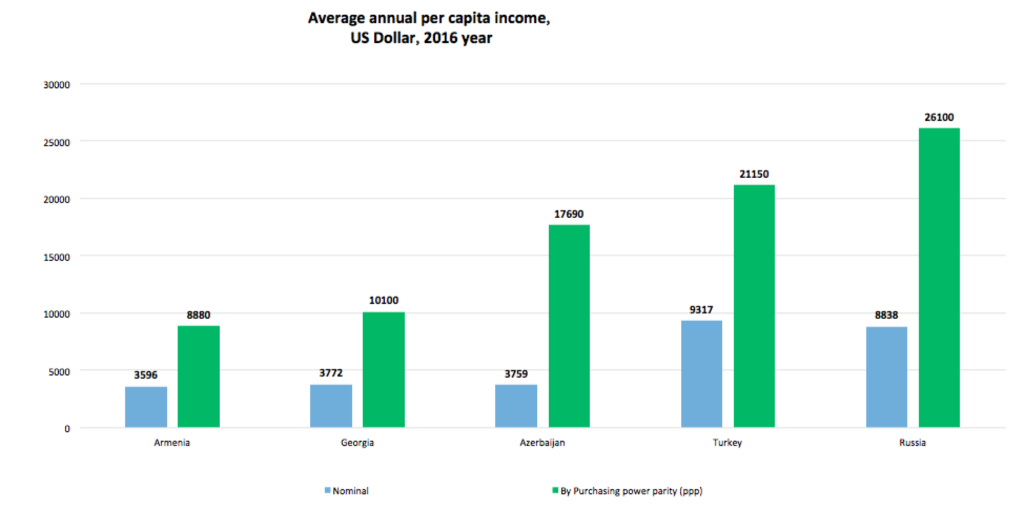
Now, let’s consider it country-by-country:
Georgia
There has been a stable political environment in Georgia in recent years; the elections have been held in a relatively peaceful atmosphere. However, there has been complex political and economic situation in other Caucasus countries, which has obviously had an adverse effect on Georgia’s economic development. Georgia has a small, open economy, the development of which largely depends on foreign investments, trade, foreign loans and aid. Georgia has been ranked 16th among 184 countries in the International Economic Globalization Index, which means that Georgia’s economy is very sensitive to other countries’ economic condition.
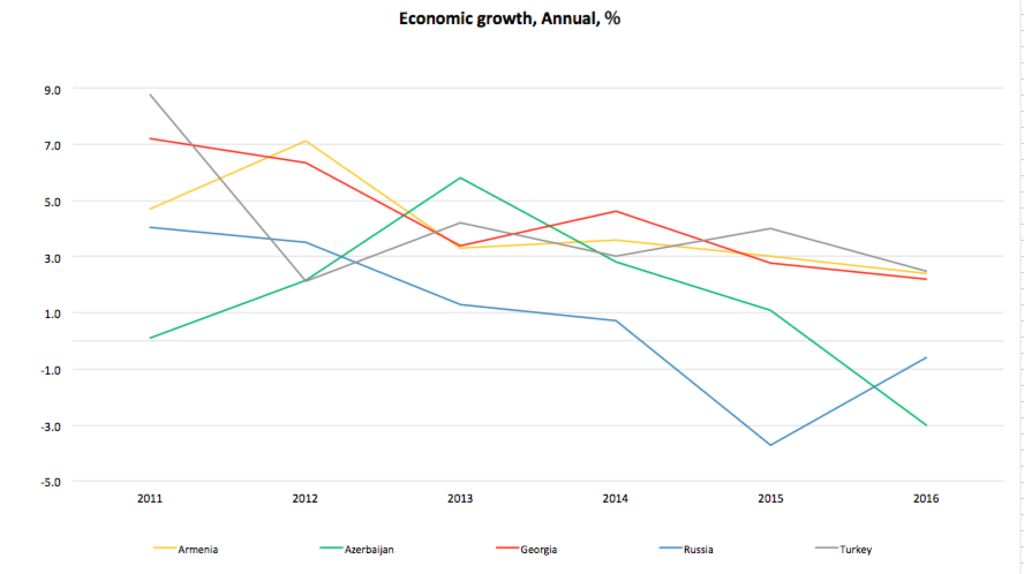
Economic growth: In 2010-2012, Georgia’s economy was growing on average by 6,6% annually, whereas in 2013-2016, the economic growth rate dropped by 3,2%. In 2016, Georgia’s economic growth made just 2,2%. A drop in the economic growth rate in 2013 was largely conditioned by a confusion and uncertainty that was formed as a result of change of power in the country. A new government’s economic development path was unclear. And also, the infrastructure development rate has considerably dropped.
National currency: Since 2014, all countries in the region have been more or less affected by the crisis. The situation in Georgia particularly worsened starting from the end of 2014 and the main reason was a drop in export volumes and remittances from abroad.
This decline in foreign exchange revenues immediately affected the Lari exchange rate. Starting from 2015, Lari was experiencing substantial depreciation and it devaluated by 53% by the end of 2016.
Inflation: The inflate rate in the country increased. A 7% increase in consumer goods prices was reported in 2015-2016.
Per capita income: Lari depreciation reduces the dollar-denominated revenues. At the same time, the general census, conducted end of 2014, revealed that Georgia’s population totaled 3,7million rather than 4,4million. Consequently, the dollar-denominated per capita income didn’t actually change over the recent years and totaled US$3,772 in 2016, whereas in terms of purchasing power (given the price difference between the USA and Georgia) it made US$10,100.
Debts: Due to the Lari depreciation and increased external debt, Georgia’s debt-to GDP ratio increased up to 42%, as compared with 35% at the end of 2013.
Unemployment rate: According to the official statistics, there was a decline in unemployment rate in the country. Unemployment rate made 12% end of 2015, whereas at the end of 2012 it made 15%.
Azerbaijan
Oil and gas industry accounts for 50% of Azerbaijan’s economy, whereas the share of oil products and gas export makes about 85% of the total export.
Economic growth: Azerbaijan’s economic growth made 5,8% in 2013. The average economic growth rate dropped by 2% in 2014-2015. Whereas in 2016, there was a 3% decline in country’s economic growth, according to the World Bank (WB) data. Azerbaijan’s economic recession is related to the recent years’ drop in oil prices.
National currency: Reduced foreign currency inflows from oil and gas exports caused depreciation of the Azerbaijani Manat. Until February 2015, the Manat had a fixed exchange rate against the US dollar–AZN0,78/US$1. Although approximately US$10billion were spent from the Central Bank’s reserves (that totaled US$15billion) to prevent further decline in the Manat rate, by the end of 2016, the Manat depreciated by 113% and the US dollar exchange rate against the Manat made US$1/AZN1,80.
Inflation: The inflation rate reached 13% in 2016.
Per capita income: The Manat depreciation and economic decline considerably reduced the dollar-denominated per capita annual income. Per capita income made US$8,000 in 2014, whereas in 2016 it dropped down to US$3,760.
Debts: Country’s debt-to GDP ratio increased from 11% to 40%.
Unemployment rate: The unemployment rate hasn’t increased. During the last 7 years, the unemployment rate was stable around 6%.
Armenia
Armenia is a country with small economy, which largely depends on the foreign investments, money remittances from abroad and loans. In 2015, Armenia joined the Eurasian Economic Union (EAEU). Consequently, it’s economy considerably depends on Russia, which accounts for 23% of Armenia’s total export.
Economic growth: In 2010-2012, Armenia’s economic growth rate made on average 4,7% annually, whereas in 2013-2016, the average annual economic growth rate dropped to 3,1%. According to the World Bank data, Armenia’s economic rate increased by 2,4% in 2016.
National currency: The critical economic situation in Russia had a considerable negative impact on Armenia. However, Armenia was less affected by the monetary crisis, compared to other countries of the region. Armenian Dram (AMD) depreciated only by 20%.
Inflation: The inflation rate remained stable. It made 1% in 2016.
Per capita income: Per capita annual income dropped by 7% and made AMD3, 596 in 2016, as against 2014, whereas in terms of purchasing power it made US$8,880.
Debts: There was increase in budget deficit and national debt. Armenia’s debt-to GDP ratio made 36,5% by the end of 2012, which increased to GDP 51% end of 2016.
Unemployment rate: The inflation rate in the country hasn’t changed and makes 18%.
Turkey
Turkey has been facing serious problems over the past few years. First of all, the noteworthy are the frequent terrorist attacks that significantly affect Turkey’s key economic branch – tourism. In 2016, Turkey’s revenues from tourism were 30% less than in 2015. Parliamentary elections in the country were held twice in 2015, due to the failure to form a coalition government as a result of the first election. There was a considerable deterioration in Turkey-Russia relations, followed by Russia’s economic sanctions. In addition, there was an armed coup attempt in summer 2016. Millions of refugees fled to Turkey as a result of the Syrian crisis.
Economic growth: Despite the aforesaid political problems, Turkish economy maintained a positive growth rate. Turkey’s average annual economic growth made 6,1% in 2010-2013. In 2014-2016, the average economic growth rate dropped to 3,2%. According to the World Bank’s early data, Turkey’s economic growth rate made 2,5% in 2016.
National currency: Turkish Lira (TRL) depreciated by 67% over the past 3 years.
Inflation rate: The inflation rate reached 9% in 2015-2016. Lira-denominated prices for consumer goods and services increased by 46%.
Per capita income: Lira depreciation conditioned a drop in US dollar-denominated incomes. Per capita income made US$ 9,317 in 2016, as compared with US$10,761 in 2013. Whereas in terms of purchasing power, the annual per capita income made US$21,150.
Unemployment rate: The unemployment rate hasn’t increased is stable around 10%.
Debts: The national debt reduced. Turkey’s debt-to GDP ratio made 36% in 2012, whereas in 2016 it made 32%.
Russia
Russian economy started facing particular problems since 2014, which was largely condition by a sharp drop in oil prices and the western countries’ sanctions, imposed on Russia due to its annexation of Crimea. Oil and gas export accounts for 60% of Russia’s total export. And also, the revenues from oil and gas sector make 50% of the federal budget revenues.
Economic growth: Russia’s average annual economic growth made 3,3% in 2010-2013. In 2014, Russia’s economic growth made 0,7%. The year 2015 turned to be the hardest one, since the economic growth rate dropped by 3,7%. According to the World Bank’s preliminary data, Russia’s economy declined by 0,6% in 2016.
National currency: Russian Ruble (RUB) depreciated by 85% in 2014-2015, and that’s against the background that Russian Central Bank’s foreign exchange reserves were reduced by US$148billion (from US$456billion to US$308billion) to stabilize the Ruble rate.
Inflation: The average annual inflation rate made 10% over the past 3 years.
Per capita income: Ruble depreciation and economic recession caused a 57% drop in the dollar-denominated incomes. Per capita income made US$8,838 in 2016, as compared with US$15,560 in 2013. In terms of purchasing power, the average annual per capita income in Russia totals US$ 26,100, making it the richest country in the Caucasus region.
Debts: National debt-to GDP ratio increased from 13% to 17%.
Unemployment rate: Since 2013, the number of unemployed people has increased by approximately 500,000 and the unemployment rate has reached 6% (it made 5,5%).

Author: Beso Namchavadze, chief economist at Georgia’s Reforms Association (GRASS); Free University lecturer.
The article is based on the IMF and WB data http://www.worldbank.org/en/publication/global-economic-prospects ; http://www.imf.org/external/ns/cs.aspx?id=28


